
CDN performance monitoring plays a pivotal role when it comes to providing a great viewing experience, as streaming operators must keep an eye on various key workflow components. For example, if encoders don’t operate properly, segments can get corrupted or quality can suffer. If the player isn’t running optimally, it can result in failures and other QoE issues.
Yet, perhaps the most important is the CDN. When the CDN being used to deliver video segments to a user isn’t operating optimally, it affects the viewer experience, from slow start times to increased rebuffer ratio to unavailable content. When those KPIs fall below acceptable levels, it translates to subscription cancellations or subscriber attrition to other providers. Ensuring optimal CDN performance, though, is not as hard as you may believe.
Why you need to improve your CDN performance monitoring
All streaming operators utilise CDNs. In fact, most of them use more than one. However, CDNs all operate and collect data differently. They also provide different tools for optimisation. This complexity results in a lot of wasted time by operations engineers and leads to the following key issues in CDN optimisation.
Huge amount of data
CDNs can produce terabytes of log data each day. Although that data is across all customers, each user may be responsible for quite a bit–imagine getting a terabyte of log data each day from six CDNs. The issue then becomes one of analysis and post-processing. It can take operations engineers a significant amount of time to cull through that data and identify issues causing QoE problems. That time also counts against issues that are evolving in real-time. If it takes three hours to identify a CDN performance problem, that’s three hours of dissatisfied viewers.
Slow error identification
When there is so much data involved–-and it’s not standardised across CDNs–it hinders CDN performance monitoring and makes identifying a specific error difficult. This increases the Mean Time to Diagnose (MTTD) and, ultimately, the Mean Time to Resolve (MTTR).
High data fragmentation
Employing multiple CDNs typically means the data is inherently fragmented. Bringing it together into a single dashboard tool is a Herculean effort, which must be adjusted whenever a CDN changes their data points. This fragmentation is even more pronounced when the streaming operator utilises each of the CDN’s own dashboards or monitoring tools. The more CDNs used, the more dashboards have to be monitored. This clutters the NOC wall and requires engineers to connect the dots themselves when performance issues span multiple delivery providers. Another issue with using CDN dashboards is that there’s also no access to detailed header data, which can provide critical insight into errors and other issues.
Real-time troubleshooting
Whether using the CDN provider dashboard or consuming log data into an existing operations tool, fragmentation, error identification, and other complexities can prevent operations engineers from providing real-time troubleshooting. For live events, this is particularly important, as literally every second counts. If stream errors occur during the event and it takes hours to identify the issues, viewer dissatisfaction has already been communicated on social media and via support emails, creating the perfect storm for your bottom line.
If left unchecked and unplanned, CDN performance monitoring can succumb to the four issues above and prevent a streaming operator from providing the best possible viewing experience. So how can you address it in a better and more effective way? It starts with the foundation of your monitoring harness and ends with a visualisation tool that does the work for you.
The CDN Performance Monitoring Pyramid: the key to effective monitoring & superior QoE
If you haven’t heard of a monitoring harness, you need to get up to speed. In short, a monitoring harness is a flexible, plug-and-play approach to data acquisition for streaming operations. It allows you to connect any data source, such as all of your CDNs, to a standard data acquisition framework.
The monitoring harness is the base of a “CDN Performance Monitoring Pyramid”. The next level, the business logic, can be a bit more fluid. This enables you to change rules over time to better reflect your viewers and specific delivery architecture.
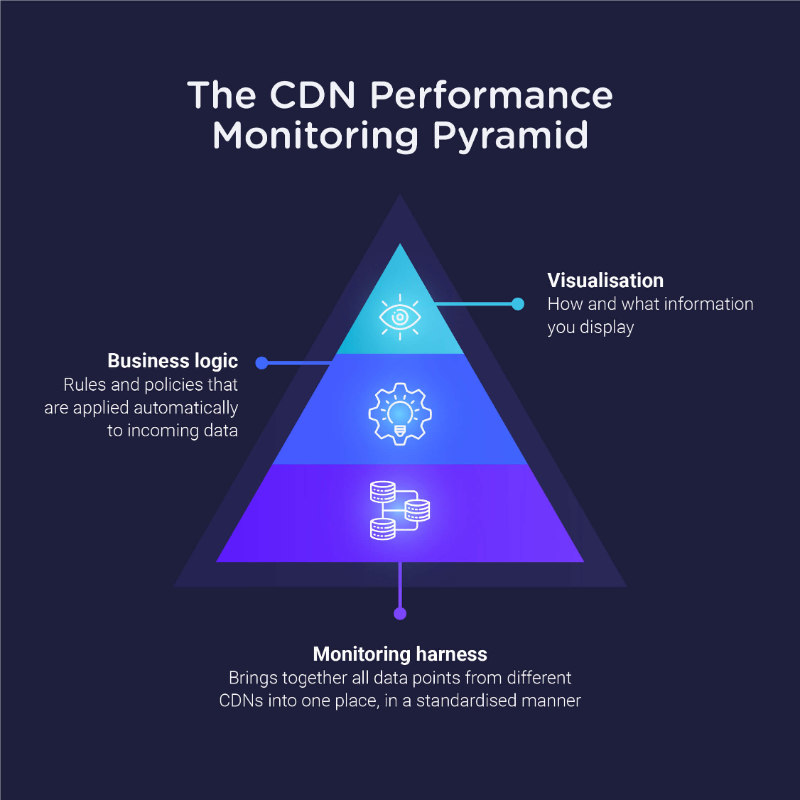
The top of the pyramid, though, is what makes for better CDN performance monitoring in several ways:
- Data integration. First and foremost, a single data visualisation tool consolidates all of the CDN data (acquired through the monitoring harness and automatically post-processed in the business logic layer) and can arrange it visually, such as using colour-coding, for quick identification of problems.
- Single-click drill-down. The problem with multiple CDN dashboards and fragmented CDN data is that it can involve a lot of mouse clicks and keyboard commands to get to the root of the problem. However, with a single dashboard that visualises the data according to colours, a single click can expand a problem node in the delivery flow, such as a CDN provider, to reveal the detailed data underneath for quick inspection.
- Faster root-cause analysis. That single-click expansion of data radically improves the MTTD and MTTR. Since your monitoring tool already shows all CDN data in one single dashboard, operations engineers don’t have to contact CDN providers to gain insights. Instead, they just one-click a CDN provider note in your tool to reveal more detailed data. This makes finding the issue much faster, especially when that data underneath is also visualised according to business layer logic.
- Proactive issue identification. What all of this leads to is seeing issues before they actually happen. For example, when the visualisation is based on thresholds in the business logic layer, yellow could mean that a CDN provider is leaning towards poor performance and should be investigated. Seeing this alert, the operations engineer uses a single-click drill-down to identify the problem early on, engage the provider, and solve it before it ever becomes an issue for the viewer. In other words, operations engineers are proactive - no need to wait for your CDN to tell you where the problem is, you’ve already identified and diagnosed it.
Hold your CDN providers accountable with a better performance monitoring approach
Perhaps one of the biggest benefits of the improved CDN performance monitoring described above is accountability. When the dashboard can be shared with providers, they can easily see their own data and how it is reflected by the streaming operator’s business layer logic. So, if that data is red (meaning it has passed a key performance threshold), then the operations engineer can drill on it with the CDN provider to examine the cause of the variance. This prevents the CDN provider from “pointing the finger” somewhere else as the visualisation is directly related to their data.
The benefits of a more intelligent CDN performance monitoring solution
Although some of the benefits are obvious, such as faster MTTD and MTTR, there is a ripple effect through the streaming value chain. First, speed, consistency, and reliability are increased, meaning your streaming service simply works better. Your subscribers don’t have to wonder if something is going to take minutes to load or not work at all. They know your service “just works.”
Second, improved QoS results in better QoE, which means happier viewers. Less downtime and buffering can equate to increased loyalty and, ultimately, an overall stronger brand. All of this will impact your bottom line: less subscriber attrition, and, when your offering is ad-supported, more impressions (and fewer ad errors, which impacts your ad revenues).
Of course, you can do this all yourself. Building that CDN Performance Monitoring Pyramid, although time- and developer-resource intensive, can be done in-house. Only you have to ask yourself: is that your core business?
If the answer is no, thankfully, Touchstream can help by providing a coherent, intuitive, and clearly visual way to analyse data from any point in time.
The solution is built on a powerful monitoring harness through which you can easily plug in data sources to bubble up in a single dashboard. Plus, although Touchstream can work with any CDN, including your own in-house CDN, it already has partnerships with Akamai, Cloudfront, Fastly, Lumen, and Edgio.
Ready to quickly diagnose and fix your CDN problems, eliminate downtime, and provide a higher QoS and QoE? Schedule a demo now.